
In this quarter’s missive, we explore the cost of taking oil out of the ground and the cost of taking money out of savings accounts.
We’re running out of oil! – Harold Ickes, US Secretary of the Interior, 1943
Peak Oil Theories
Although peak oil theories began to be published in the 1950s, the fear of running out of oil has been around since the 1800s when petroleum competed with whale oil as a source of light. With the rapid and unexpected decline in oil prices, we thought it would be interesting to spend a moment reviewing where we are and what could unfurl in the next few years. Despite all of the news concerning oil prices remaining low for an extended time, the major oil producers around the world are very different from those in the US; they are owned or controlled by governments.
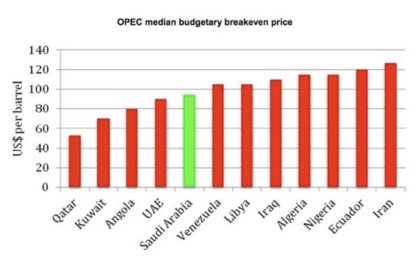
The accompanying chart details not the cost of extracting oil, which may be very low, but the cost needed to fund these countries budgets.
As petrostates, oil revenues factor very significantly to their ability to pay for defense as well as social services budgets. Fear of unrest may drive prices back towards $70-80 per barrel in the medium term.
In the meantime, consuming countries like the U.S. are taking advantage. Trucks, which burn more gasoline, outsold cars in December by the most since 2005, according to data from Ward’s Automotive Group.
As far as possibly running out of oil one day, we believe that Morris Adelman captured our thoughts best in his 1995 book, The Genie out of the Bottle: World Oil Since 1970 where he stated, “No mineral, including oil, will ever be exhausted. If and when the cost of finding and extraction goes above the price consumers are willing to pay, the industry will begin to disappear.”
Safe Withdrawal Rates on Savings and the 4% Rule
A topic that has been revisited many times over the years is withdrawal rates and the 4% rule. As we have emphasized over time, a 4% withdrawal rate is a good starting point but the answer is a little more complicated and every client’s situation is unique.
We recently came across the following table that helps convey the nuances of these rates. It illustrates that your choice of investments may have an equal importance to your withdrawal rate.
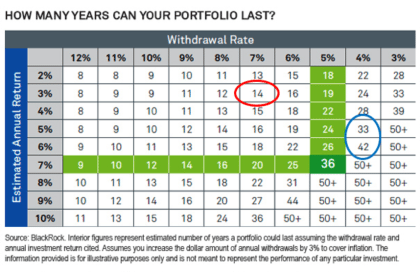
For the sake of example, at one extreme, suppose your investments were all in CDs earning 3% and you chose to withdraw 7% of your assets at the start of your retirement. Further, you increased your withdrawal amount by inflation each year. Looking at the table, the red circle is at the intersection of 7% withdrawal rate along the top and the 3% return along the left side. The number 14 in the box means that your assets would be expected to last only 14 years. By contrast, if you withdrew only 4% and invested in a balanced portfolio of stocks and bonds returning 5-6%, your portfolio might be expected to last 33-42 years as noted by the blue circle. For some thoughts on how long you may need your portfolio to last, see our article “Calculating Your Life Expectancy”.
[hr]