[button link=”https://sfadvisors.com/wp-content/uploads/2016/04/Better-Investment-Brochure-V3.pdf” size=”small” style=”darkteal”]Investment Guide[/button] Check out our FREE GUIDE on Pursuing a Better Investment Experience
To see our other videos on Pursuing a Better Investment Experience, please Like Us on Facebook or Click Here to subscribe to our blog posts.
You never know which market segments will outperform from year to year. By holding a globally diversified portfolio, investors are well positioned to capture returns wherever they occur.
This graph features annual ranked performance of major asset classes in the U.S. and international markets from 2000 – 2014. The asset classes are represented by corresponding market indices. Each asset class is represented by a different shade of blue.
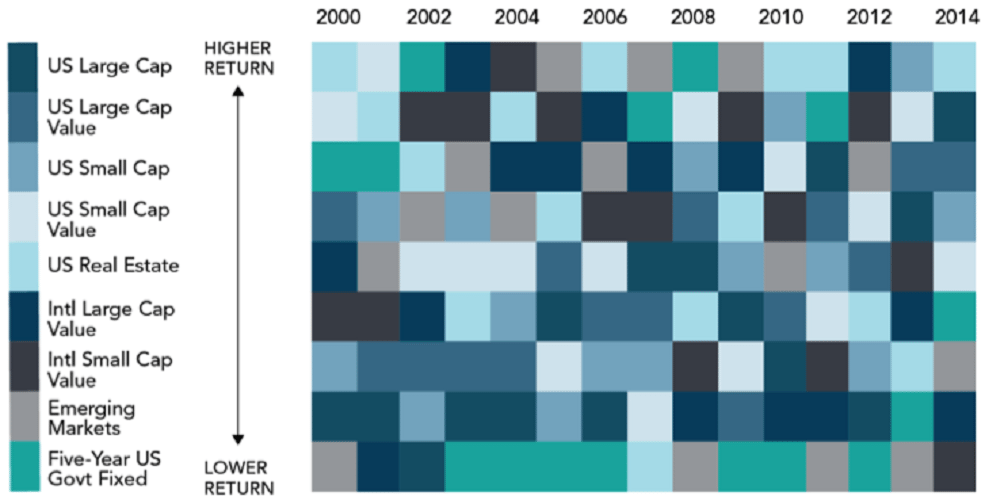
Even with a globally diversified portfolio, market movements can tempt investors to switch asset classes based on predictions of future performance. But as shown in this table, there is little predictability in asset class performance from one year to the next.
The data shows no obvious pattern of performance across asset classes, suggesting that predicting future performance is a difficult task. These charts offer additional evidence for investors to rely on portfolio structure, rather than market timing, to pursue returns.
Disclosure: Diversification does not eliminate the risk of market loss. This information is for illustrative purposes only. Indices are not available for direct investment. Index performance does not reflect the expenses associated with the management of an actual portfolio. Past performance is not a guarantee of future results.
Source: In US dollars. US Large Cap is the S&P 500 Index, provided by Standard & Poor’s Index Services Group. US Large Cap Value is the Russell 1000 Value Index. US Small Cap is the Russell 2000 Index. US Small Cap Value is the Russell 2000 Value Index. Russell data © Russell Investment Group 1995–2015, all rights reserved. US Real Estate is the Dow Jones US Select REIT Index, provided by Dow Jones Indexes. International Large Cap Value data provided by Fama/French from Bloomberg and MSCI securities data. International Small Cap Value data compiled by Dimensional from Bloomberg and Style Research securities data. Emerging Markets is the MSCI Emerging Markets Index (gross dividends), © MSCI 2015, all rights reserved. Five‐Year US Government Fixed is the Barclays Capital Treasury Bond Index 1−5 Years, formerly Lehman Brothers, provided by Barclays Bank PLC.