[button link=”https://sfadvisors.com/wp-content/uploads/2016/04/Better-Investment-Brochure-V3.pdf” size=”small” style=”darkteal”]Investment Guide[/button] Check out our FREE GUIDE on Pursuing a Better Investment Experience
To see our other videos on Pursuing a Better Investment Experience, please Like Us on Facebook or Click Here to subscribe to our blog posts.
Some investors select mutual funds based on past returns. However, funds that have outperformed in the past do not always persist as winners.
Past performance alone provides little insight into a fund’s ability to outperform in the future. Some investors use mutual fund track records as a guide to selecting funds, reasoning that a manager’s past outperformance is likely to continue into the future.
Does this assumption pay off? The research offers strong evidence to the contrary.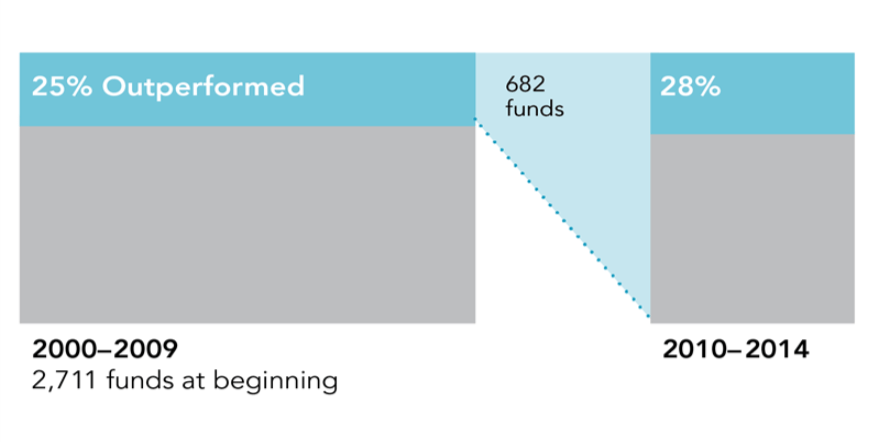 This chart illustrates the lack of persistence in outperformance among U.S. equity mutual funds. The funds are evaluated based on their 10-year track records (2000-2009), and those that beat their respective benchmarks are re-evaluated in the subsequent 5-year period (2010-2014).
Among the 2,711 equity funds that began the initial 10-year period, only 25% outperformed – and among these 682 winning funds, only 28% continued to beat their benchmarks in the subsequent 5-year period. Some U.S. equity fund managers may be better than others, but they are hard to identify in advance using track records alone. Returns contain a lot of noise, and impressive track records often result from good luck. The assumption that past outperformance will continue often proves faulty and leaves many investors disappointed.
Disclosure: The graph shows the proportion of U.S. equity mutual funds that outperformed and underperformed their respective benchmarks during the initial 10‐year period ending December 31, 2009. Outperforming were reevaluated in the subsequent 5‐ year period from 2010 through 2014, with the graph showing outperformers and underperformers. Fund count and percentages may not correspond due to rounding. Past performance is no guarantee of future results.
Source: The U.S. Mutual Fund Landscape 2015, Dimensional Fund Advisors. U.S.‐domiciled mutual fund data is from the CRSP Survivor‐Bias‐Free U.S. Mutual Fund Database, provided by the Center for Research in Security Prices, University of Chicago.