People in both fields operate with beliefs and biases. To the extent you can eliminate both and replace them with data, you gain a clear advantage. ― Michael Lewis, Moneyball: The Art of Winning an Unfair Game
Bill James and Baseball
In the book Moneyball, Lewis spends a considerable part of the beginning of the book explaining the work of Bill James and how his ground breaking research demonstrated why baseball should be viewed through a different set of statistics than were then employed at the time. Much of the rest of the book is devoted to Billy Beane and how he employed these findings in creating a winning franchise with the Oakland A’s despite their extraordinarily modest budget.
What is most amazing about Lewis’ book is its effect on the management of baseball teams after its revelations concerning how to better measure players and teams. In essence, very little. Beane began to utilize James’ statistics in the late 1990s, about twenty years after James’ Abstract was first published. Outside of Beane, the only other notable change is John Henry of the Boston Red Sox who hired James in 2003. With these new techniques and Henry’s large player budget, the Red Sox have gone on to win the World Series in 2004, 2007, and 2013. In an efficient market, this knowledge would be incorporated by most participants (coaches, managers and owners) and its effect would slowly disappear. On last check, Billy Beane and the A’s have compiled a .617 winning percentage in the current season, placing them at the top of the American League.
So what accounts for this anomaly? Behavioral psychology. James’ measurements of players’ worth were counterintuitive. Further, they are not that interesting. He valued a player’s ability to get on base. Therefore, walks are as valuable as a base hit. This is important for two reasons; first, any player who got on base did not get out and second, any player who got on base is in a much better position to score. Baseball continues to emphasizes power and speed. The latter two skills are the fodder of baseball scouts. Beane and the A’s employ statisticians and computers.
Billy Beane and Investing
How do these findings relate to retirement planning and investing? Liz Ann Sonders, market strategist at Schwab, when queried about her views on stocks and markets, responded by expounding on her views of the financial services business. Basically, she said that our business is not that exciting and the more exciting you try to make it, the less chance you have for success. We agree. Like baseball, you should seek sound and unexciting investments, steady asset allocation and effective diversification. Further, one of the best ways “to get on base” and be “in a position to score” is to make sure you are saving enough through the employment of financial planning. Adequate savings, solid but unexciting investments, and time are the key components of “scoring runs” in your retirement plan.
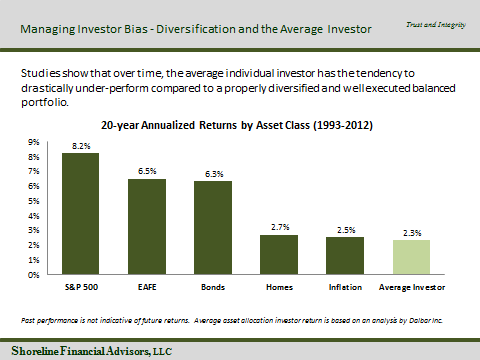
In the following chart, we can further demonstrate that, like baseball, the wide availability of statistical information does not always translate into the efficient use of that knowledge.

Dalbar publishes data on individual investor returns over long periods of time. These are investors in stock and bond mutual funds, or balanced portfolios. As demonstrated on the left, in the twenty years ended 2012, the US stock market, as represented by the S&P500 appreciated by 8.2% per annum. Bonds, as represented by the Barclays Aggregate returned 6.3% over the same period. Surprisingly, residential real estate was only up by 2.7%, edging out inflation by only 0.2%. The most unfortunate result is that the return for the average investor in stocks and bonds (light green bar), at 2.3%, did not even beat inflation. Many investors sold low and bought high. The most difficult part of investing is utilizing the counterintuitive information to create simple strategies to help in “Winning an Unfair Game”.

